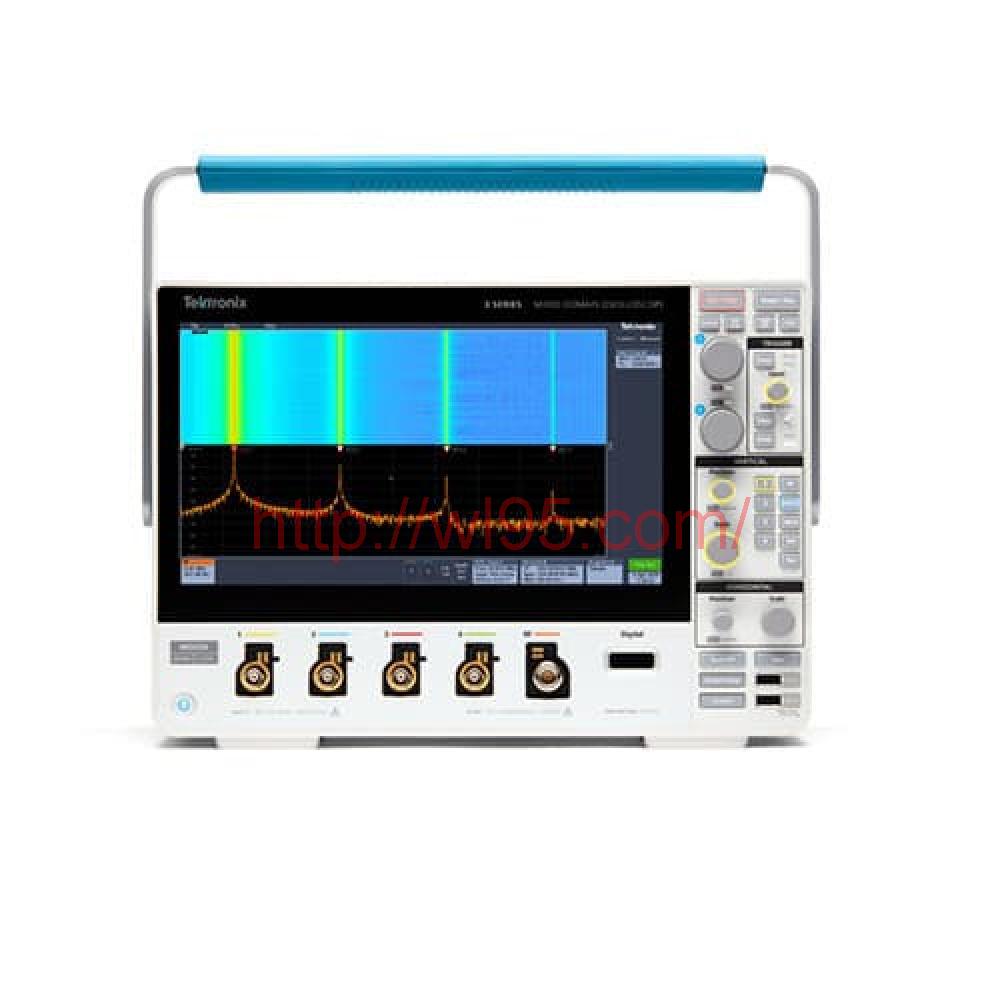


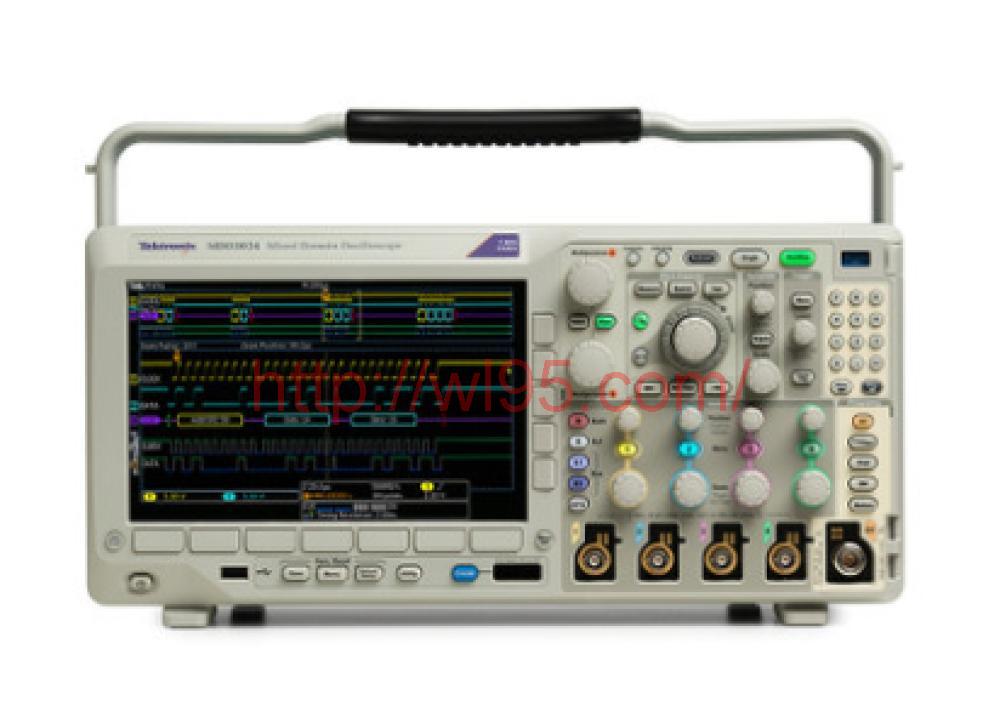
泰克MDO323BW100 100 MHz,2通道,2.5 GS / s混合域示波器,具有8位垂直分辨率和11.6英寸高清触摸屏,记录长度为10 M,为您的工作台增加了更多功能-附带的频谱分析仪和独立的RF输入,MDO32允许您快速调试设计并跟踪不需要的EMI辐射源,而无需跟踪独立的分析仪。

频道配置菜单
设置栏-关键参数和波形管理
波形和示波器操作参数显示在沿着显示屏底部的设置栏中的一系列标记中。设置栏可立即访问最常见的波形管理任务。
结果栏-分析和测量
显示屏右侧的结果栏包括对光标,测量,搜索和总线解码结果表等最常用分析工具的一键式访问。
光标,测量和搜索结果标记显示在结果栏中,而不会牺牲任何波形查看区域。对于附加的波形查看区域,可以随时关闭结果栏,然后将其调回。

电容式触摸屏
范围已包括触摸屏多年,但触摸屏是事后才想到的。MDO32 11.6英寸显示器包括电容式触摸屏,并提供了真正为触摸而设计的用户界面。
MDO32支持您在手机和平板电脑上使用的触摸交互,以及在启用触摸的设备中进行的触摸交互。
流畅,响应灵敏的前面板控件使您可以使用熟悉的旋钮和按钮进行调整,还可以添加鼠标或键盘作为第三种交互方式。
MDO32的核心是世界一流的示波器,它提供了全面的工具,可加快调试的各个阶段-从快速发现异常并捕获异常,到在波形记录中搜索感兴趣的事件并分析其特性和设备的行为。
要调试设计问题,首先必须知道它的存在。每个设计工程师都花费时间寻找设计中的问题,这是一项耗时且令人沮丧的任务,而没有正确的调试工具。

FastAcq波形捕获
数字荧光粉技术可让您快速了解设备的实际操作。它的快速波形捕获率-FastAcq大于280,000 wfms / s-使您有很高的可能性快速看到数字系统中常见的不常见问题:欠幅脉冲,毛刺,定时问题等。
为了进一步增强很少发生的事件的可见性,强度等级用于指示相对于正常信号特征发生罕见瞬变的频率。FastAcq采集模式下有四个可用的波形调色板。
这些调色板可以快速突出显示随着时间的流逝而发生的事件,或者在不常见的异常情况下,发生频率更低的事件。
无限或可变的余辉选择可确定波形在显示屏上停留的时间,从而帮助您确定异常发生的频率。

捕捉事件
发现设备故障只是第一步。接下来,您必须捕获感兴趣的事件以识别根本原因。为了实现这一点,MDO32包含超过125种触发组合,提供了一组完整的触发器-包括欠幅,逻辑,脉冲宽度/毛刺,建立和保持违规,串行数据包和并行数据-可帮助快速定位您感兴趣的事件。记录长度高达10 M,您可以在一次采集中捕获许多感兴趣的事件,甚至数千个串行数据包,以进行进一步的分析,同时保持高分辨率以放大精细的信号细节。

自动测量
验证原型的性能是否与仿真相符并满足项目的设计目标,需要进行仔细的分析,从简单的检查上升时间和脉冲宽度到复杂的功率损耗分析,系统时钟表征以及噪声源研究。
MDO32提供了一套全面的标准分析工具,包括:
测量结果表提供了测量结果的全面统计视图。
如果没有合适的搜索工具,则在长时间的波形记录中找到您感兴趣的事件可能会很耗时。如今,记录长度已达到数百万个数据点,因此定位事件可能意味着滚动浏览数千个信号活动屏幕。
MDO32通过其创新的屏幕控件提供了业界最全面的搜索和波形导航。这些控件可加快记录的平移和缩放速度。在显示器上使用直观的捏合/展开手势来调查长记录中感兴趣的区域。

搜索功能
搜索功能使您可以自动搜索您的长时间采集,以查找用户定义的事件。该事件的所有发生都用搜索标记突出显示,并且可以使用显示屏上“搜索”标志上的“上一个”(←)和“下一个”(→)按钮轻松导航到该事件。搜索类型包括边沿,脉冲宽度,超时,欠幅,逻辑,建立和保持,上升/下降时间以及并行/串行总线数据包内容。

电能质量测量表
消费者对更长的电池寿命设备以及消耗更少功率的绿色解决方案的需求不断增长,因此电源设计人员必须确定其特性并最小化开关损耗以提高效率。此外,电源的功率水平,输出纯度和输入电源线的谐波反馈必须经过表征,以符合国家和地区的电源质量标准。从历史上看,在示波器上进行这些和许多其他功率测量是一个漫长,手动和繁琐的过程。MDO32可选的功率分析工具极大地简化了这些任务,从而能够对功率质量,开关损耗,谐波,安全工作区(SOA),调制,纹波和压摆率(di / dt,dv / dt)进行快速,可重复和准确的分析。 。功率分析工具完全集成到示波器中,可提供自动化,轻触按钮即可重复进行功率测量。可选的功耗分析功能在30天的试用期内免费提供。首次打开仪器电源时,此免费试用期将自动开始。
泰克MDO系列是唯一提供基于硬件的集成频谱分析仪的示波器。MDO32的频谱分析仪频率范围为9 kHz至1 GHz(可用的可选3GHz扩展),可对IoT和大多数消费者无线标准进行频谱分析。

频域显示
使用频谱分析仪标准的N连接器输入时,MDO32显示屏将变为全屏的频谱分析仪视图。
关键的频谱参数,例如中心频率,跨度,参考电平和分辨率带宽,都可以使用屏幕上的触摸控件快速,轻松地进行调整。
在传统的频谱分析仪中,打开并放置足够的标记以识别所有感兴趣的峰值可能是一项非常繁琐的任务。MDO32通过将标记自动放置在峰值上来指示每个峰值的频率和幅度,从而使该过程更加有效。您可以调整示波器用于自动查找峰的标准。
最高振幅峰值称为参考标记,并以红色显示。标记读数可以在绝对读数和增量读数之间切换。当选择Delta时,标记读数将显示每个峰相对于参考标记的delta频率和delta幅度。

自动峰标记
还可以使用两个手动光标来测量频谱的非峰值部分。启用后,参考标记会附加到一个光标上,从而可以在频谱中的任何位置进行增量测量。除频率和幅度外,光标读数还包括噪声密度和相位噪声读数,具体取决于选择的是绝对读数还是增量读数。“参考标记居中”功能可立即将参考标记指示的频率移动到中心频率。
MDO32包含一个频谱图显示,非常适合监视缓慢变化的RF现象。x轴代表频率,就像典型的频谱显示一样。但是,y轴表示时间,而颜色用于表示振幅。
频谱图切片是通过获取每个光谱并将其“翻转到边缘”生成的,以使其高一个像素行,然后根据该频率下的振幅为每个像素分配颜色。冷色(蓝色,绿色)幅度较低,而较热的颜色(黄色,红色)幅度较高。每一次新的采集都会在频谱图的底部添加另一个切片,并且历史记录将向上移动一行。停止采集后,您可以向后滚动频谱图以查看任何单独的频谱切片。

频谱图显示

光谱显示

频谱轨迹
当今的无线通信使用复杂的数字调制方案以及通常涉及突发输出的传输技术,会随着时间发生巨大变化。这些调制方案也可以具有非常宽的带宽。传统的扫频或阶梯式频谱分析仪无法随时查看这些类型的信号,因为它们只能在任何时间查看一小部分频谱。
一次采集中采集的频谱量称为捕获带宽。传统频谱分析仪将捕获带宽扫描或步进到所需的跨度以构建所需的图像。结果,在频谱分析仪获取频谱的一部分时,您关心的事件可能发生在频谱的另一部分。当今市场上的大多数频谱分析仪具有10 MHz的捕获带宽,有时在某些情况下具有昂贵的选件将其扩展到20、40甚至160 MHz。
为了满足现代RF的带宽要求,MDO32提供了高达3 GHz的捕获带宽。频谱是通过一次采集生成的,因此可以确保您在频域中看到正在寻找的事件。
MDO32频谱分析仪提供四种不同的迹线或视图,包括“正常”,“平均值”,“最大保持”和“最小保持”。

自动通道功率测量
MDO32包括三个自动RF测量-信道功率,相邻信道功率比和占用带宽。激活这些RF测量之一后,示波器会自动打开“平均频谱”迹线,并将检测方法设置为“平均”以获得最佳测量结果。
频谱分析仪上的信号输入方法通常仅限于电缆连接或天线。除了使用标准的N连接器之外,MDO32频谱分析仪还可以将50ΩTekVPI探头与可选的TPA-N-VPI适配器一起使用。这在寻找噪声源时提供了更大的灵活性,并通过在频谱分析仪输入上使用真实的信号浏览功能使频谱分析更加容易。
另外,可选的前置放大器附件有助于研究低振幅信号。TPA-N-PRE前置放大器在9 kHz-3 GHz频率范围内提供10 dB的标称增益。

波形类型选择
MDO32包含一个可选的集成任意函数发生器(选件3-AFG),非常适合模拟设计中的传感器信号或向信号中添加噪声以执行裕度测试。
集成函数发生器为正弦波,方波,脉冲,斜坡/三角形,DC,噪声,sin(x)/ x(Sinc),高斯,洛伦兹,指数上升/下降,Haversine和心脏提供高达50 MHz的预定义波形输出。

弹性设定
任意波形发生器提供128 k点记录,用于存储来自模拟输入,已保存的内部文件位置,USB大容量存储设备或来自外部PC的波形。通过USB或LAN或使用USB大容量存储设备将波形文件传输到MDO32编辑存储器,以从示波器的AFG输出。

查看模拟和数字信号
逻辑分析仪(选件3-MSO)提供16个数字通道,这些通道紧密集成到示波器的用户界面中。这简化了操作,使轻松解决混合信号问题成为可能。
用颜色编码的数字迹线以绿色显示一个,以蓝色显示零。数字通道监视器中也使用了这种颜色。监视器会显示信号是高电平,低电平还是正在转换,因此您可以一目了然地看到通道活动,而不必因不必要的数字波形而使显示混乱。

彩色显示
当系统检测到多个转换时,多重转换检测硬件将在显示屏上显示白色边缘。白色边缘表示可以通过放大或以更快的采样率获取更多信息。在大多数情况下,放大将显示在以前的设置下看不到的脉冲。如果在尽可能放大后仍存在白色边缘,则表明在下一次采集时增加采样率将显示比以前的设置更高的频率信息。
您可以将数字波形分组并在触摸屏上轻松输入波形标签。通过简单地将数字波形彼此相邻放置,它们就形成了一个组。形成组后,您可以集中放置该组中包含的所有通道。这大大减少了与单独定位通道相关的正常设置时间
MDO32上的主要数字采集模式将以500 MS / s(2 ns的分辨率)捕获多达10 M的数据。除了主要记录外,MDO32还提供了称为MagniVu的超高分辨率记录,该记录以高达8.25 GS / s(121.2 ps的分辨率)获得10,000点。每次触发时都会采集主波形和MagniVu波形,并且可以在运行或停止时随时在显示屏中进行切换。与市场上的同类示波器相比,MagniVu提供了更好的定时分辨率,从而在对数字波形进行关键定时测量时树立了信心。

P6316可选探头
这种独特的探头设计提供了两个八通道转接器,从而简化了连接到被测设备的过程。当连接到方形销钉时,P6316可以直接连接到以十分之一英寸为中心的8×2方形销钉接头。如果需要更大的附件灵活性,则可以使用随附的飞线组和抓取器夹在表面安装设备或测试点上。P6316具有出色的电气特性,仅施加8 pF的电容性负载,输入阻抗为101kΩ。

触发方式
在串行总线上,单个信号通常包含地址,控制,数据和时钟信息。这会使隔离感兴趣的事件变得困难。总线事件和条件的自动触发,解码和搜索为您提供了一套强大的调试串行总线的工具。在30天的试用期内免费提供了可选的串行协议触发和分析功能。首次打开仪器电源时,此免费试用期将自动开始。
在流行的串行接口(例如I2C,SPI,RS-232 / 422/485 / UART,USB2.0,CAN,CAN FD)上触发数据包内容(例如数据包开始,特定地址,特定数据内容,唯一标识符等) ,LIN,FlexRay,MIL-STD-1553,ARINC429和I2S / LJ / RJ / TDM。
提供组成总线的单个信号(时钟,数据,芯片使能等)的更高级的组合视图,使您可以轻松识别数据包的开始和结束位置以及子数据包组件(例如地址,数据) ,标识符,CRC等。
厌倦了不得不目视检查波形以对时钟进行计数,确定每个位是1还是0,将位组合为字节并确定十六进制值的方法?让示波器为您服务!设置总线后,MDO32将解码总线上的每个数据包,并以十六进制,二进制,十进制(仅USB,CAN,CAN FD,LIN,FlexRay,MIL-STD-1553和ARINC429)显示值),带符号的十进制(仅I2S / LJ / RJ / TDM)或总线波形中的ASCII(仅USB,MIL-STD-1553和RS-232 / 422/485 / UART)。

活动表
除了查看总线波形本身上的已解码数据包数据外,还可以像在软件列表中一样,以表格视图查看所有捕获的数据包。数据包带有时间戳,并针对每个组件(地址,数据等)逐列列出。您可以将事件表数据保存为.CSV格式。
串行触发对于隔离感兴趣的事件非常有用,但是一旦您捕获了它并需要分析周围的数据,您会怎么做?过去,用户必须手动滚动查看波形计数和转换位,并查找导致事件的原因。您可以让示波器自动在采集的数据中搜索用户定义的标准,包括串行数据包内容。每次出现都会以搜索标记突出显示。在标记之间快速导航就像按屏幕上的上一个(←)和下一个(→)按钮一样简单。

直流测量
MDO32包含一个集成的4位数字电压表(DVM)和5位频率计数器。任何模拟输入都可以用作电压表的源,使用与普通示波器使用的探头相同的探头。DVM和频率计数器可在任何MDO32上使用,并在注册产品时被激活。
MDO32具有11.6英寸(295毫米)宽屏高清显示屏(1920 x 1080),可查看复杂的信号细节。
MDO32包含许多端口,可用于将仪器连接到网络,直接连接到PC或其他测试设备。
导出数据和测量结果就像将USB电缆从示波器连接到PC一样简单。关键软件应用程序-OpenChoice®Desktop,Microsoft Excel和Word工具栏可实现与Windows PC的快速,轻松直接通信。
OpenChoice Desktop可以通过USB或LAN在示波器和PC之间进行快速简便的通信,以传输设置,波形和屏幕图像。
嵌入式e *Scope®功能可通过标准的Web浏览器通过网络连接快速控制示波器。只需输入示波器的IP地址或网络名称,就会向浏览器提供一个网页。直接从Web浏览器传输和保存设置,波形,测量值和屏幕图像,或实时更改示波器上的设置。
凭借紧凑,便携式的外形,您可以轻松地在实验室之间移动示波器。深度仅为5.9英寸(149毫米),可为您节省测试台上宝贵的空间。MDO32在一台仪器中提供了日常调试任务所需的所有工具。
MDO32附带有无源电压探头的标准配置,并使用TekVPI探头接口。
MDO32包括无源电压探头,其行业最佳电容负载仅为3.9 pF。随附的TPP探头最大程度地减少了对被测设备的影响,并将信号准确地传送到示波器进行采集和分析。

TekVPI探针接口
TekVPI探针接口设置了易于使用的标准。除界面提供的安全可靠连接外,TekVPI探头还具有状态指示器和控件,以及位于补偿盒本身的探头菜单按钮。此按钮将在示波器显示屏上弹出一个探针菜单,其中包含该探针的所有相关设置和控件。TekVPI接口可直接连接电流探头,而无需单独的电源。TekVPI探针可以通过USB,GPIB或LAN进行远程控制,从而在ATE环境中提供更多功能的解决方案。仪器通过内部电源为前面板连接器提供高达25 W的功率。
The Tektronix MDO323BW100 100 MHz, 2-Channel, 2.5 GS/s Mixed Domain Oscilloscope with 8-bit Vertical Resolution and 11.6 in. HD Touchscreen, 10 M Record Length adds more capability to your bench - with an included spectrum analyzer and separate RF inputs, the MDO32 allows you to quickly debug your designs and track down sources of unwanted EMI emissions, without tracking down a standalone analyzer.
Channel Configuration Menu
The Settings Bar - key parameters and waveform management
Waveform and scope operating parameters are displayed in a series of badges in the Settings Bar that runs along the bottom of the display. The Settings Bar provides immediate access for the most common waveform management tasks.
The Results Bar - analysis and measurements
The Results Bar on the right side of the display includes immediate, one tap access to the most common analytical tools such as cursors, measurements, searches and bus decode results tables.
Cursors, measurements and search results badges are displayed in the Results Bar without sacrificing any waveform viewing area. For additional waveform viewing area, the Results Bar can be dismissed and brought back at any time.
Capacitive Touch Display
Scopes have included touch screens for years, but the touch screen has been an afterthought. The MDO32 11.6 inch display includes a capacitive touchscreen and provides a user interface truly designed for touch.
The touch interactions that you use with phones and tablets, and expect in a touch enabled device, are supported in the MDO32.
Smooth, responsive front panel controls allow you to make adjustments with familiar knobs and buttons, and you can add a mouse or keyboard as a third interaction method.
At the core of the MDO32 is a world-class oscilloscope, offering comprehensive tools that speed each stage of debug - from quickly discovering anomalies and capturing them, to searching your waveform record for events of interest and analyzing their characteristics and your device's behavior.
To debug a design problem, first you must know it exists. Every design engineer spends time looking for problems in their design, a time consuming and frustrating task without the right debug tools.
FastAcq Waveform Capture
Digital phosphor technology provides you with fast insight into the real operation of your device. Its fast waveform capture rate - greater than 280,000 wfms/s with FastAcq - gives you a high probability of quickly seeing the infrequent problems common in digital systems: runt pulses, glitches, timing issues, and more.
To further enhance the visibility of rarely occurring events, intensity grading is used to indicate how often rare transients are occurring relative to normal signal characteristics. There are four waveform palettes available in FastAcq acquisition mode.
These color palettes quickly highlight the events that over time occur more often or, in the case of infrequent anomalies, occur less often.
Infinite or variable persistence choices determine how long waveforms stay on the display, helping you to determine how often an anomaly is occurring.
Capturing Events
Discovering a device fault is only the first step. Next, you must capture the event of interest to identify root cause. To enable this, the MDO32 contains over 125 trigger combinations providing a complete set of triggers - including runt, logic, pulse width/glitch, setup and hold violation, serial packet, and parallel data - to help quickly locate your event of interest. And with up to a 10 M record length, you can capture many events of interest, even thousands of serial packets, in a single acquisition for further analysis while maintaining high resolution to zoom in on fine signal details.
Automated Measurements
Verifying that your prototype's performance matches simulations and meets the project's design goals requires careful analysis, ranging from simple checks of rise times and pulse widths to sophisticated power loss analysis, characterization of system clocks, and investigation of noise sources.
The MDO32 offers a comprehensive set of standard analysis tools including:
Measurement results tables provide comprehensive statistical views of measurement results.
Finding your event of interest in a long waveform record can be time consuming without the right search tools. With today's record lengths of many millions of data points, locating your event can mean scrolling through literally thousands of screens of signal activity.
The MDO32 offers the industry's most comprehensive search and waveform navigation with its innovative on-screen controls. These controls speed panning and zooming through your record. Use intuitive pinch/ expand gestures on the display itself to investigate areas of interest in a long record.
Search Feature
The Search feature allows you to automatically search through your long acquisition looking for user-defined events. All occurrences of the event are highlighted with search marks and are easily navigated to, using the Previous ( ← ) and Next ( → ) buttons found on the Search badge on the display. Search types include edge, pulse width, timeout, runt, logic, setup and hold, rise/fall time and parallel/serial bus packet content.
Power Quality Measurement Table
Ever increasing consumer demands for longer battery-life devices and for green solutions that consume less power require power-supply designers to characterize and minimize switching losses to improve efficiency. In addition, the supply's power levels, output purity, and harmonic feedback into the power line must be characterized to comply with national and regional power quality standards. Historically, making these and many other power measurements on an oscilloscope has been a long, manual, and tedious process. The MDO32 optional power analysis tools greatly simplify these tasks, enabling quick, repeatable and accurate analysis of power quality, switching loss, harmonics, safe operating area (SOA), modulation, ripple, and slew rate (di/dt, dv/dt). Completely integrated into the oscilloscope, the power analysis tools provide automated, repeatable power measurements with a touch of a button. The optional power analysis functionality is offered free for a 30-day trial period. This free trial period starts automatically when the instrument is powered on for the first time.
The Tektronix MDO series is the only oscilloscope to offer an integrated, hardware-based spectrum analyzer. The spectrum analyzer frequency range of the MDO32 is from 9 kHz to 1 GHz (optional 3GHz extension available), enabling spectral analysis on IoT and most consumer wireless standards.
Frequency Domain Display
When using the spectrum analyzer standard N-connector input, the MDO32 display becomes a full-screen Spectrum Analyzer view.
Key spectral parameters such as Center Frequency, Span, Reference Level, and Resolution Bandwidth are all adjusted quickly and easily using on-screen touch controls.
In a traditional spectrum analyzer, it can be a very tedious task to turn on and place enough markers to identify all your peaks of interest. The MDO32 makes this process far more efficient by automatically placing markers on peaks that indicate both the frequency and the amplitude of each peak. You can adjust the criteria that the oscilloscope uses to automatically find the peaks.
The highest amplitude peak is referred to as the reference marker and is shown in red. Marker readouts can be switched between Absolute and Delta readouts. When Delta is selected, marker readouts show each peak's delta frequency and delta amplitude from the reference marker.
Automated Peak Markers
Two manual cursors are also available for measuring non-peak portions of the spectrum. When enabled, the reference marker is attached to one of the cursors, enabling delta measurements from anywhere in the spectrum. In addition to frequency and amplitude, cursor readouts also include noise density and phase noise readouts depending on whether Absolute or Delta readouts are selected. A "Reference Marker to Center" function instantly moves the frequency indicated by the reference marker to center frequency.
The MDO32 includes a spectrogram display which is ideal for monitoring slowly changing RF phenomena. The x-axis represents frequency, just like a typical spectrum display. However, the y-axis represents time, and color is used to indicate amplitude.
Spectrogram slices are generated by taking each spectrum and "flipping it up on its edge" so that it's one pixel row tall, and then assigning colors to each pixel based on the amplitude at that frequency. Cold colors (blue, green) are low amplitude and hotter colors (yellow, red) are higher amplitude. Each new acquisition adds another slice at the bottom of the spectrogram and the history moves up one row. When acquisitions are stopped, you can scroll back through the spectrogram to look at any individual spectrum slice.
Spectrogram Display
Spectral Display
Spectrum Traces
Today's wireless communications vary significantly with time, using sophisticated digital modulation schemes and, often, transmission techniques that involve bursting the output. These modulation schemes can have very wide bandwidth as well. Traditional swept or stepped spectrum analyzers are ill equipped to view these types of signals as they are only able to look at a small portion of the spectrum at any one time.
The amount of spectrum acquired in one acquisition is called the capture bandwidth. Traditional spectrum analyzers sweep or step the capture bandwidth through the desired span to build the requested image. As a result, while the spectrum analyzer is acquiring one portion of the spectrum, the event you care about may be happening in another portion of the spectrum. Most spectrum analyzers on the market today have 10 MHz capture bandwidths, sometimes with expensive options to extend that to 20, 40, or even 160 MHz in some cases.
In order to address the bandwidth requirements of modern RF, the MDO32 provides up to 3 GHz of capture bandwidth. The spectrum is generated from a single acquisition, thus guaranteeing you'll see the events you're looking for in the frequency domain.
The MDO32 spectrum analyzer offers four different traces or views including Normal, Average, Max Hold, and Min Hold.
Automated Channel Power Measurement
The MDO32 includes three automated RF measurements - Channel Power, Adjacent Channel Power Ratio, and Occupied Bandwidth. When one of these RF measurements is activated, the oscilloscope automatically turns on the Average spectrum trace and sets the detection method to Average for optimal measurement results.
Signal input methods on spectrum analyzers are typically limited to cabled connections or antennas. In addition to using the standard N-connector, the MDO32 Spectrum Analyzer can use 50 Ω TekVPI probes with the optional TPA-N-VPI adapter. This enables additional flexibility when hunting for noise sources and enables easier spectral analysis by using true signal browsing on a spectrum analyzer input.
In addition, an optional preamplifier accessory assists in the investigation of lower-amplitude signals. The TPA-N-PRE preamplifier provides 10 dB nominal gain across the 9 kHz - 3 GHz frequency range.
Waveform Type Selection
The MDO32 contains an optional integrated arbitrary function generator (option 3-AFG), perfect for simulating sensor signals within a design or adding noise to signals to perform margin testing.
The integrated function generator provides output of predefined waveforms up to 50 MHz for sine, square, pulse, ramp/triangle, DC, noise, sin(x)/x (Sinc), Gaussian, Lorentz, exponential rise/fall, Haversine and cardiac.
Flexible Settings
The arbitrary waveform generator provides 128 k points of record for storing waveforms from the analog input, a saved internal file location, a USB mass storage device, or from an external PC. Transfer waveform files to your MDO32 edit memory via USB or LAN or using a USB mass storage device to be output from the AFG in the oscilloscope.
View Analog and Digital Signals
The logic analyzer (option 3-MSO) provides 16 digital channels which are tightly integrated into the oscilloscope's user interface. This simplifies operation and makes it possible to solve mixed-signal issues easily.
Color-coded digital traces display ones in green and zeros in blue. This coloring is also used in the digital channel monitor. The monitor shows if signals are high, low, or are transitioning so you can see channel activity at a glance without having to clutter your display with unneeded digital waveforms.
Color-Coded Display
The multiple transition detection hardware shows you a white edge on the display when the system detects multiple transitions. White edges indicate that more information is available by zooming in or acquiring at faster sampling rates. In most cases zooming in will reveal the pulse that was not viewable with the previous settings. If the white edge is still present after zooming in as far as possible, this indicates that increasing the sample rate on the next acquisition will reveal higher frequency information than the previous settings could acquire.
You can group digital waveforms and enter waveform labels easily on the touchscreen. By simply placing digital waveforms next to each other, they form a group. Once a group is formed, you can position all the channels contained in that group collectively. This greatly reduces the normal setup time associated with positioning channels individually
The main digital acquisition mode on the MDO32 will capture up to 10 M at 500 MS/s (2 ns resolution). In addition to the main record, the MDO32 provides an ultra high-resolution record called MagniVu which acquires 10,000 points at up to 8.25 GS/s (121.2 ps resolution). Both main and MagniVu waveforms are acquired on every trigger and can be switched between in the display at any time, running or stopped. MagniVu provides significantly finer timing resolution than comparable oscilloscopes on the market, instilling confidence when making critical timing measurements on digital waveforms.
P6316 Optional Probe
This unique probe design offers two eight-channel pods, simplifying the process of connecting to the device-under-test. When connecting to square pins, the P6316 can connect directly to 8×2 square pin headers spaced on tenth-inch centers. When more attachment flexibility is required, you can use the included flying lead sets and grabbers to clip onto surface mount devices or test points. The P6316 offers outstanding electrical characteristics applying only 8 pF of capacitive loading with 101 kΩ input impedance.
Triggering
On a serial bus, a single signal often includes address, control, data, and clock information. This can make isolating events of interest difficult. Automatic trigger, decode, and search on bus events and conditions gives you a robust set of tools for debugging serial buses. The optional serial protocol triggering and analysis functionality is offered free for a 30-day trial period. This free trial period starts automatically when the instrument is powered on for the first time.
Trigger on packet content such as start of packet, specific addresses, specific data content, unique identifiers, etc. on popular serial interfaces such as I2C, SPI, RS-232/422/485/UART, USB2.0, CAN, CAN FD, LIN, FlexRay, MIL-STD-1553, ARINC429, and I2S/LJ/RJ/TDM.
Provides a higher-level, combined view of the individual signals (clock, data, chip enable, etc.) that make up your bus, making it easy to identify where packets begin and end and identifying sub-packet components such as address, data, identifier, CRC, etc.
Tired of having to visually inspect the waveform to count clocks, determine if each bit is a 1 or a 0, combine bits into bytes, and determine the hex value? Let the oscilloscope do it for you! Once you've set up a bus, the MDO32 will decode each packet on the bus, and display the value in hex, binary, decimal (USB, CAN, CAN FD, LIN, FlexRay, MIL-STD-1553, and ARINC429 only), signed decimal (I2S/LJ/RJ/TDM only), or ASCII (USB, MIL-STD-1553 and RS-232/422/485/UART only) in the bus waveform.
Event table
In addition to seeing decoded packet data on the bus waveform itself, you can view all captured packets in a tabular view much like you would see in a software listing. Packets are time stamped and listed consecutively with columns for each component (Address, Data, etc.). You can save the event table data in .CSV format.
Serial triggering is very useful for isolating the event of interest, but once you've captured it and need to analyze the surrounding data, what do you do? In the past, users had to manually scroll through the waveform counting and converting bits and looking for what caused the event. You can have the oscilloscope automatically search through the acquired data for user-defined criteria including serial packet content. Each occurrence is highlighted by a search mark. Rapid navigation between marks is as simple as pressing the Previous (←) and Next (→) buttons on the screen.
A DC Measurement
The MDO32 contains an integrated 4-digit digital voltmeter (DVM) and 5-digit frequency counter. Any of the analog inputs can be a source for the voltmeter, using the same probes that are already attached for general oscilloscope usage. The DVM and frequency counter is available on any MDO32 and is activated when you register your product.
The MDO32 features an 11.6 inch (295 mm) wide-screen, HD display (1920 x 1080) for seeing intricate signal details.
The MDO32 contains a number of ports which can be used to connect the instrument to a network, directly to a PC, or other test equipment.
Exporting data and measurements is as simple as connecting a USB cable from the oscilloscope to your PC. Key software applications - OpenChoice® Desktop, and Microsoft Excel and Word toolbars enable fast and easy direct communication with your Windows PC.
The OpenChoice Desktop enables fast and easy communication between the oscilloscope and your PC through USB or LAN for transferring settings, waveforms, and screen images.
The embedded e*Scope® capability enables fast control of the oscilloscope over a network connection through a standard web browser. Simply enter the IP address or network name of the oscilloscope and a web page will be served to the browser. Transfer and save settings, waveforms, measurements, and screen images or make live control changes to settings on the oscilloscope directly from the web browser.
With the compact, portable form factor, you can easily move the oscilloscope between labs. And with a depth of just 5.9 inches (149 mm), it saves you valuable space on your test bench. The MDO32 has all the tools you'll need for everyday debug tasks, all in a single instrument.
The MDO32 ships standard with passive voltage probes and uses the TekVPI probe interface.
The MDO32 include passive voltage probes with industry best capacitive loading of only 3.9 pF. The included TPP probes minimize the impact on devices under test and accurately deliver signals to the oscilloscope for acquisition and analysis.
TekVPI Probe Interface
The TekVPI probe interface sets the standard for ease of use in probing. In addition to the secure, reliable connection that the interface provides, TekVPI probes feature status indicators and controls, as well as a probe menu button right on the comp box itself. This button brings up a probe menu on the oscilloscope display with all relevant settings and controls for the probe. The TekVPI interface enables direct attachment of current probes without requiring a separate power supply. TekVPI probes can be controlled remotely through USB, GPIB, or LAN, enabling more versatile solutions in ATE environments. The instrument provides up to 25 W of power to the front panel connectors from the internal power supply.
Copyright © 2007 All Rights Reserved. 深圳市晧辰电子科技有限公司 版权所有 [粤ICP备14101712号-1] [法律顾问]
公司地址:广东省深圳市南山区南山智谷产业园F座1402 邮编:518055