
描述:
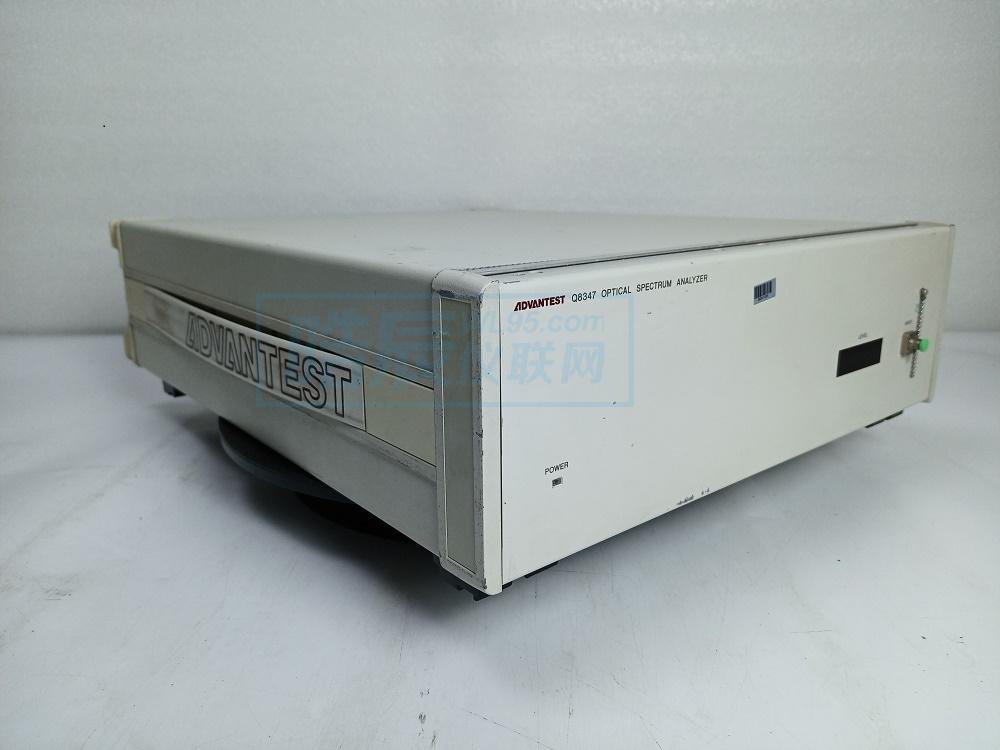
Q8347是Advantest的光学分析仪。光谱分析仪,也称为光学分析仪,是一种测量光源功率的精密仪器。该电子测试设备用于监视指定波长范围内的功率分配。它在图形中显示测量值,其中功率是垂直刻度,波长是水平刻度。
附加功能:
技术指标
波长
水平
测量范围(输入灵敏度):
最小水平在50 nm跨度上测量,平均16次。
处理功能
输入输出
一般规格
Advantest Q8347频谱分析仪使用带有迈克尔逊干涉仪的傅立叶频谱系统,增强了频谱分析仪的性能。Q8347在1550 nm光谱带上实现0.01 nm的波长分辨率和±0.01 nm的波长精度(在光频率模式下为1 GHz的分辨率和±1 GHz的精度)。此外,Q8347能够通过分离光谱来准确测量光波分复用(WDM)传输信号的每个波长。它特别适合评估用于ADM和光纤光栅等WDM的光学窄带滤波器的特性。而且,Q8347还可以分析LD和孤子传输的chi声。
在500 nm波段的分辨率为0.001 nm
在较短的波长下,可以获得更高的分辨率。Q8347在500 nm波段的分辨率为0.001 nm,最适合分析蓝色LD。
趋势监控功能
入射功率和波长可以数字读数以及时域趋势图显示。
标配打印机和软盘驱动器
该系统配备了高速热敏打印机,能够在8秒内复制显示内容。此外,系统还有一个使用MS-DOS的软盘驱动器,可以轻松进行数据存储和分析。此外,数据以文本格式存储,便于在个人计算机上进行分析和处理。同样,可以随后缩放存储的数据。
可以显示光频率
除了一般的波长显示模式外,可以将测得的光谱显示为光频率。由于可以以太赫兹为单位直接读取光,因此对于测量光学WDM和来自LD的线性调频信号以及分析Soliton传输系统非常有用。
±165 mm的相干分析
由于Q8347使用迈克尔逊干涉仪,因此该系统能够执行相干分析。使用此功能可以轻松评估光盘LD的噪声抑制性能。此外,可以大大增加干涉仪的行程,以允许在±165 mm的范围内进行分析。因此,可以在常规的次级最大峰值(α值)之上和之上进行更详细的分析。
曲线拟合功能
Q8347提供具有sech和高斯函数的曲线拟合。因此,对于孤子传输系统的频谱分析很有用。
清单显示
频谱或相干数据的峰值可以显示为最多包含200个点的数值数据。一眼就能看到光WDM传输系统的每个通道的间隔和水平。
高速测量
使用GPIB在正常分辨率模式下从触发到SRQ输出的过程仅花费1.0秒,在高分辨率模式下则仅花费2.5秒。(在长波段)。
测量原理
Q8347使用带有迈克尔逊干涉仪的傅立叶光谱系统。来自被测设备的光被分为两部分,并且在两条最终路径之间引入了干涉。以光程差为横轴,干涉光强度为纵轴的干涉图使被测定光自相关。
因此,可以从干涉图显示相干性。此外,可以通过对干涉图执行快速傅立叶变换(FFT)来获得光谱。由于He-Ne激光器用作波长参考源,因此波长轴和光程差非常精确。
应用领域
彼此非常接近的高分辨率光谱测量
Q8347可以精确地测量彼此非常接近的光谱,例如,它可以测量WDM传输系统的光谱,该系统采用的光谱间隔为0.1 nm(波长为1550 nm时约为10 GHz)。
测量光学窄带通滤波器的传输特性
作为具有大功率宽带光源(例如EDFA的自发发射光或边缘发射LED)的系统,Q8347可以准确地测量EDFA系统中使用的光学窄带通滤波器的传输特性,精度为±0.01纳米 在测量光谱宽度为1 nm的滤波器时,动态范围为35 dB(平均16倍)。中心波长以下30 dB处的线性度为±0.5 dB或更小。
超短光脉冲的频谱测量
使用Q8347,可以直接查看超短光脉冲的频谱扩展,例如孤子传输。
右图是数据的副本,显示了在10 GHz重复频率下测量超短光脉冲时的频谱宽度,以及具有sech函数的曲线拟合性能。
大范围的一致性分析
Q8347可以测量LD和SLD(超级发光二极管)的相干性,最大最大值为±165 mm,因此,可以对器件进行详细分析。另外,第二峰值(α值)可以通过以零光程差将最大峰值处的相干标准化来测量并显示。
The Q8347 is an optical analyzer from Advantest. An optical spectrum analyzer, also called an optical analyzer, is a precision instrument that measures the power of an optical source. This electronic test equipment is for monitoring power distribution over a specified wavelength span. It displays the measurement in a graph, where power is the vertical scale and wavelength is the horizontal scale.
Additional Features:
Specifications
Wavelength
Level
Measurement Range (Input Sensitivity):
The minimum level is measured over a 50 nm span and averaging 16 times.
Processing Functions
Input/Output
General Specifications
The Advantest Q8347 spectrum analyzer enhanced the performance of spectrum analyzer employing a Fourier spectrum system with a Michelson interferometer. The Q8347 achieves wavelength resolution of 0.01 nm and wavelength accuracy of ±0.01 nm (resolution of 1 GHz and accuracy of ±1 GHz in optical frequency mode) at the 1550 nm spectrum band. In addition, the Q8347 is capable of accurately measuring each wavelength of optical wavelength division multiplexing (WDM) transmission signal by separating the spectrums. It is especially suitable for evaluating characteristics of optical narrow-band-pass filters used for WDM like AWG and Fiber gratings. Also, the Q8347 is powerful for analyzing chirps from LDs and Soliton transmission.
A resolution of 0.001 nm at the 500 nm band
At shorter wavelength, higher resolution can be obtained. The Q8347 has a resolution of 0.001 nm at the 500 nm band, most suitable for analysis of blue LDs.
Trend monitoring function
Incoming power and wavelength can be displayed in digital read-out, as well as a time domain trend chart.
Printer and floppy-disk drive equipped as standard
The system comes with high-speed thermal printer capable of copying the display in 8 seconds. Also, the system has a floppy-disk drive using MS-DOS, allowing easy data storage and analysis. Furthermore, data are stored in text format, facilitating analysis and processing on a personal computer. Also, stored data can be zoomed subsequently.
Optical frequency can be displayed
In addition to general wavelength display mode, a measured spectrum can be displayed as optical frequencies. As light can be directly read in units of THz, it is useful for measuring optical WDM and chirps from LDs, and for analyzing Soliton transmission system.
Coherence analysis of ±165 mm
As the Q8347 uses a Michelson interferometer, the system is capable of performing coherence analysis. This function allows easy evaluation of noise suppression performance of LDs for optical discs. Furthermore, the stroke of the interferometer can be greatly increased to allow analysis to be made in a range of ±165 mm. Thus, more detailed analysis can be mode, over and above the conventional secondary maximum peak value (α value).
Curve fitting function
The Q8347 provides curve fitting with sech and Gaussian functions. Thus, it is useful for spectrum analysis of Soliton transmission system.
List display
Peak values of spectrum or coherence data can be displayed as numerical data containing up to 200 points. The separation and the level of each channel of optical WDM transmission system can be seen at a glance.
High-speed measurement
The process from trigger to SRQ output takes only 1.0 second in normal resolution mode by using the GPIB, or 2.5 seconds in high-resolution mode. (At long-wavelength band).
Measurement principles
The Q8347 employs the Fourier spectrum system using a Michelson interferometer. The light from the device under measurement is split into two parts and interference introduced between the two resulting paths. The interferogram, taking the optical path difference as the horizontal axis and the interference light intensity as the vertical axis, makes an autocorrelation of the light to be measured.
Thus, coherence can be displayed from the interferogram. Also, the optical spectrum can be obtained by performing Fast Fourier Transform (FFT) over the interferogram. As an He-Ne laser is used as the wavelength reference source, the axes of the wavelength and optical path difference are extremely accurate.
Applications
High resolution measurement of spectrums extremely close to each other
The Q8347 accurately measures spectrums extremely close to each other, for example it measures spectrums for WDM transmission systems which employs spectrums separated at 0.1 nm (Approximately 10 GHz at wavelength of 1550 nm).
Measuring the transmission characteristics of optical narrow-bandpass filters
As a system with high-power, wide-band light source such as spontaneous emission light of EDFA or edge-emitting LED, the Q8347 accurately measures the transmission characteristics of optical narrow-band-pass filters employed for EDFA systems at the accuracy ±0.01 nm. In measuring a filter with spectral-width of 1 nm, dynamic range is 35 dB (Averaging 16 times). Linearity at the level 30 dB down from the central wavelength is ±0.5 dB or less.
Spectrum measurement of ultra-short light pulse
With the Q8347, spectrum stretch of ultra-short light pulse, Soliton transmission for example, can be directly viewed.
The figure to the right is a copy of the data showing the spectrum width when the ultra-short light pulse at 10 GHz repetition was measured and curve fitting performance with sech function.
Coherency analysis at long span
The Q8347 measures coherency of LDs and SLDs (Super Luminescent Diode) to ±165 mm maximum, therefore, the detailed analysis of the device is possible. Also, the 2nd peak value (α value) can be measured and displayed by normalizing the coherence at the maximum peak value with zero optical path difference.


Copyright © 2007 All Rights Reserved. 深圳市晧辰电子科技有限公司 版权所有 [粤ICP备14101712号-1] [法律顾问]
公司地址:广东省深圳市南山区西丽街道官龙村华纵科技楼5楼 邮编:518055
在线QQ服务: 服务热线:0755-86016691 电话:13715327187 传真:0755-86641139-816
E-mail:info@wl95.com